Let’s talk about user-defined functions in DAX. If you’ve been working with Power BI or Analysis Services for a while, you’ve probably found yourself copying and pasting the same DAX logic across multiple measures. It works, sure, but it’s a bit rubbish when you need to change something and have to hunt down every instance. That’s where user-defined functions come in properly handy.
What Are User-Defined Functions, Actually?
Think of user-defined functions (UDFs) as your own custom DAX functions that sit alongside the built-in ones like SUM, CALCULATE, and all the rest. You write them once, give them a name, and then use them wherever you need them. Simple as that.
They’re not just about being lazy (though that’s a nice bonus). They genuinely make your models easier to maintain, easier to understand, and less prone to those annoying little errors that creep in when you’re manually copying complex logic around.
A Quick Note About the Tools
Before we dive in, you need to know that user-defined functions can’t be created directly in Power BI Desktop’s interface. You’ll need an external tool called Tabular Editor to add them to your model. Tabular Editor 2 is free and connects to Power BI Desktop whilst it’s running, letting you edit the underlying model structure.
Here’s how it works in practice:
- User-defined functions are created in Tabular Editor – you write the function definition there
- Measures that use those functions are created in Power BI Desktop – once the function exists, you use it like any built-in DAX function
- You can also create measures in Tabular Editor if you prefer, but most people find Power BI Desktop’s interface more comfortable for that
For this post, I’m assuming you’ve got Tabular Editor 2 installed and connected to your Power BI file. If you haven’t set it up yet, don’t worry – it’s straightforward. You can find detailed setup instructions in a separate guide, but here’s the quick version:
- Download and install Tabular Editor 2 (it’s free)
- Enable enhanced metadata format in Power BI Desktop (File > Options > Preview features)
- Open your Power BI file
- Launch Tabular Editor from the External Tools ribbon in Power BI Desktop
- You’re connected and ready to add functions
Throughout this post, when I show function definitions like FUNCTION CalculateProfitMargin(...), that’s what you’ll write in Tabular Editor. When I show measures like Product Profit Margin = ..., you can write those in Power BI Desktop’s measure editor after you’ve saved the function from Tabular Editor.
Right, with that sorted, let’s get into the actual functions.
The Basics: How to Write One
The syntax is straightforward enough:
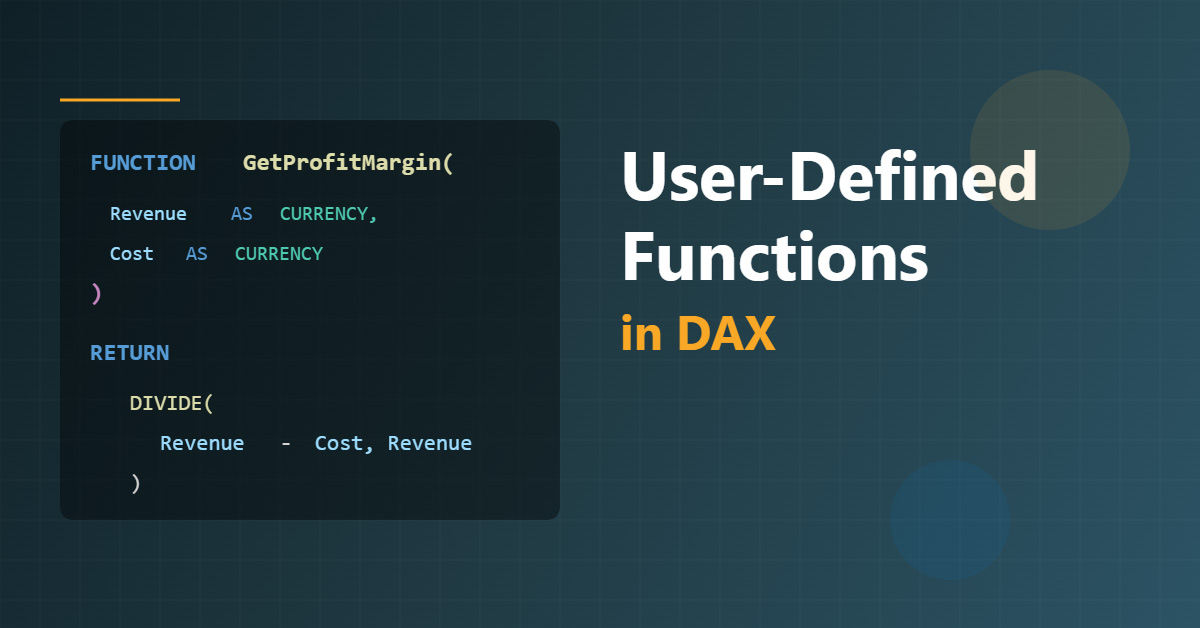
FUNCTION FunctionName(Parameter1 AS DataType, Parameter2 AS DataType) RETURN -- Your calculation hereLet’s start with something simple using Adventure Works. Say we’re constantly calculating profit margins across different measures. Instead of writing (Revenue - Cost) / Revenue over and over, we can create a function:
FUNCTION CalculateProfitMargin(Revenue AS CURRENCY, Cost AS CURRENCY) RETURN DIVIDE(Revenue - Cost, Revenue, 0)Notice I’ve used DIVIDE with a third parameter? That’s to handle division by zero gracefully. Always worth doing when you’re building something you’ll use repeatedly.
Now we can use this function in any measure:
Product Profit Margin = VAR ProductRevenue = SUM(FactResellerSales[SalesAmount]) VAR ProductCost = SUM(FactResellerSales[TotalProductCost]) RETURN CalculateProfitMargin(ProductRevenue, ProductCost)Getting More Sophisticated
Here’s where it gets interesting. You can pass tables to functions, not just scalar values. This opens up loads of possibilities.
Let’s say we want to calculate year-over-year growth, but we want to be specific about which date column we’re using and what we’re measuring. Adventure Works has sales across different time periods, so this is actually quite useful:
FUNCTION CalculateYoYGrowth( MeasureValue AS CURRENCY, DateColumn AS DATETIME ) VAR CurrentPeriodValue = MeasureValue VAR PreviousYearValue = CALCULATE( MeasureValue, SAMEPERIODLASTYEAR(DateColumn) ) RETURN DIVIDE( CurrentPeriodValue - PreviousYearValue, PreviousYearValue, BLANK() )Now we can create measures like:
Sales YoY Growth = CalculateYoYGrowth( SUM(FactResellerSales[SalesAmount]), 'DimDate'[FullDateAlternateKey] ) Order Quantity YoY Growth = CalculateYoYGrowth( SUM(FactResellerSales[OrderQuantity]), 'DimDate'[FullDateAlternateKey] )See how much cleaner that is? And if you need to change how you calculate year-over-year growth (maybe you want to use a different time intelligence function), you only change it in one place.
Real-World Example: Customer Segmentation
Let’s build something more complex. Adventure Works tracks customers, and we might want to segment them based on their purchasing behaviour. We could write a function that categorises customers:
FUNCTION ClassifyCustomer(TotalPurchases AS CURRENCY) VAR Classification = SWITCH( TRUE(), TotalPurchases >= 100000, "Premium", TotalPurchases >= 50000, "Gold", TotalPurchases >= 10000, "Silver", "Bronze" ) RETURN ClassificationThen use it in a calculated column or measure:
Customer Segment = VAR CustomerTotal = CALCULATE( SUM(FactResellerSales[SalesAmount]), ALLEXCEPT(FactResellerSales, FactResellerSales[ResellerKey]) ) RETURN ClassifyCustomer(CustomerTotal)Working with Tables: The Powerful Stuff
You can also create functions that accept and return entire tables. This is brilliant for complex filtering scenarios.
Here’s a function that filters products based on multiple criteria:
FUNCTION GetHighValueProducts( MinimumSales AS CURRENCY, ProductCategory AS STRING ) VAR FilteredProducts = FILTER( VALUES(DimProduct[ProductKey]), VAR ProductSales = CALCULATE( SUM(FactResellerSales[SalesAmount]), ALLEXCEPT(DimProduct, DimProduct[ProductKey]) ) VAR ProductCat = RELATED(DimProductSubcategory[EnglishProductCategoryName]) RETURN ProductSales >= MinimumSales && ProductCat = ProductCategory ) RETURN FilteredProductsYou’d use this in a measure like:
High Value Bikes Revenue = CALCULATE( SUM(FactResellerSales[SalesAmount]), GetHighValueProducts(50000, "Bikes") )Date Intelligence Made Easier
Date intelligence functions are another area where UDFs shine. Adventure Works has multiple date tables and fact tables, and you often need consistent date calculations across them.
FUNCTION CalculateMTD( MeasureExpression AS CURRENCY, DateColumn AS DATETIME ) VAR MTDValue = CALCULATE( MeasureExpression, DATESMTD(DateColumn) ) RETURN MTDValue FUNCTION CalculateQTD( MeasureExpression AS CURRENCY, DateColumn AS DATETIME ) VAR QTDValue = CALCULATE( MeasureExpression, DATESQTD(DateColumn) ) RETURN QTDValueNow creating period-to-date measures becomes dead simple:
Sales MTD = CalculateMTD( SUM(FactResellerSales[SalesAmount]), 'DimDate'[FullDateAlternateKey] ) Sales QTD = CalculateQTD( SUM(FactResellerSales[SalesAmount]), 'DimDate'[FullDateAlternateKey] )The Gotchas (Because There Always Are Some)
Before you get too excited, there are a few things to watch out for:
Context transition doesn’t happen automatically. If your function needs row context to become filter context, you need to explicitly use CALCULATE. This trips people up more often than you’d think.
They’re not stored procedures. UDFs are evaluated every time they’re called. If you’re calling the same function multiple times with the same parameters in one measure, you’re recalculating it each time. Use variables to cache results when needed.
Parameter types matter. DAX is pretty strict about data types in functions. If you define a parameter as CURRENCY, don’t try to pass it a DATE. It won’t work.
No recursion. You can’t have a function call itself. If you’re thinking of building a recursive function, you’ll need to work out another approach.
Limited scope. Functions need to be defined before you can use them in measures or calculated columns. The order matters in your model definition.
When Should You Actually Use Them?
Not everything needs to be a function. If you’re only using a calculation once, just write it inline. Functions are for logic that you’ll reuse at least a few times.
Good candidates for UDFs:
- Complex business rules that apply across multiple measures
- Calculations you need to standardise across your organisation
- Date intelligence patterns you use repeatedly
- Custom filtering logic that’s specific to your business
- Any calculation where you find yourself copying and pasting
Bad candidates:
- One-off calculations
- Things that are already simple with built-in functions
- Logic that’s likely to need different variations in different contexts
Performance Considerations
UDFs don’t inherently make things slower or faster. They’re essentially macros that get expanded when your DAX is evaluated. However, they can help performance indirectly by making your code cleaner and easier to optimise.
One thing to watch: if you’re calling a function inside an iterator (like SUMX), and that function contains its own CALCULATE statements, you can end up with nested context transitions. That can get expensive quickly with large tables. Adventure Works is relatively small, so you won’t notice it there, but in production models with millions of rows, it matters.
Practical Tips from the Trenches
Name your functions clearly. Use a prefix like “fn” or “Calculate” so they’re easy to spot in IntelliSense. When you’ve got hundreds of measures, you’ll thank yourself.
Document your parameters. Put comments in your function explaining what each parameter does and what data types are expected. Future you (or your colleagues) will appreciate it.
Test edge cases. Always test your functions with blank values, zeros, and negative numbers. Use DIVIDE instead of / to handle division by zero. Use BLANK() instead of 0 when that’s more appropriate.
Keep them focused. One function should do one thing well. If you’re writing a massive function that does everything, split it into smaller, more manageable pieces.
Version control is your friend. If you’re working in a team, treat your UDFs like code. Document changes, use version control, and have a review process.
Wrapping Up
User-defined functions in DAX are one of those features that seem simple at first but become increasingly valuable as you use them. They won’t revolutionise your models overnight, but they’ll make your life easier in lots of small ways that add up.
Start small. Pick one calculation you’re constantly rewriting and turn it into a function. Get comfortable with the syntax and how they behave. Then gradually build up a library of functions that reflect your business logic.
The Adventure Works examples here are just starting points. Your own business will have its own patterns and calculations that are perfect candidates for functions. The trick is recognising them when you see them and taking the time to refactor them properly.
There’s something quite satisfying about having a neat collection of well-written functions that make your measures readable and maintainable. It’s the sort of thing that doesn’t get celebrated much, but it makes a real difference to the quality of your work.